Hendry County Jail, FL: Inmate Search, Visitation, Commissary, and More
- State
- Florida
- City
- Labelle
- Postal Code
- 33975
- County
- Hendry County
- Phone Number
- 863-675-1853, 863-674-4060
- Telephone Carrier
- TelMate Inmate Calling
- Type
- County Jail
- Location
- 101 South Bridge Street PO Box 579, Labelle, FL, 33975
- Official Website
- http://www.hendrysheriff.org/
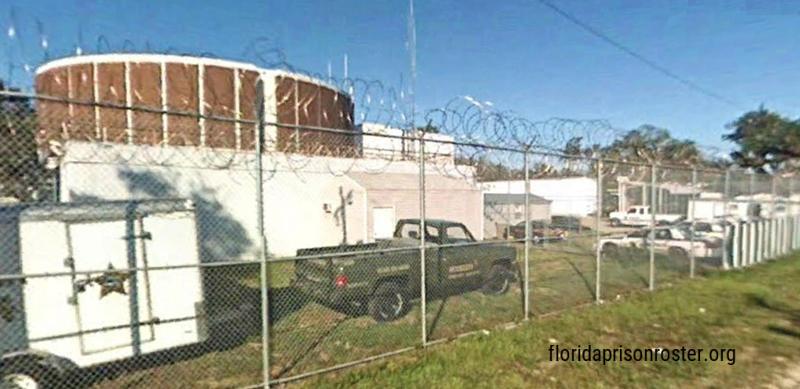
Located in Hendry County, Florida, the Hendry County detention facility is Adult correctional institution run by the Hendry County Sheriffs Office – Substation. It is based in Labelle. The facility’s address is 101 South Bridge Street, , PO Box 579, Labelle, FL, 33975, and the phone number is 863-675-1853, 863-674-4060. The facility’s website is http://www.hendrysheriff.org/. It has a capacity to house 161 detainees at a time.
Inmate Search Process
Offenders in Hendry County Jail can be searched online via an Inmate Roster on the facility’s website. Offline, one can directly call the facility at 863-675-1853, 863-674-4060 or visit the Hendry County Sheriffs Office – Substation. Data needed for search include the detainee’s name or booking number.
Commissary System
The facility’s commissary allows offenders to purchase items like toiletries, snacks, and stationery. Family and friends can contribute funds to a offender’s account online, over the phone, or through a kiosk in the institution’s lobby.
Mailing Rules
When mailing to inmates at Hendry County correction facility, ensure to include the offender’s full name and booking number. All mail, except legal mail, is inspected for contraband. No packages or items other than letters and photos are allowed.
Mailing address:
101 South Bridge Street, , PO Box 579, Labelle, FL, 33975
Visitation Rules
Visitation at Hendry County detention facility is based on the offender’s housing unit. An ID is required and visitors must not have felony convictions or pending charges. Visitation hours vary, check with the facility for specific times.
The visiting hours are as follows:
Monday — 7:30 AM to 9:00 PM
Tuesday — 7:30 AM to 9:00 PM
Wednesday — 7:30 AM to 9:00 PM
Thursday — 7:30 AM to 9:00 PM
Friday — 7:30 AM to 9:00 PM
Saturday — 7:30 Am to 2:30 PM
Sunday — 7:30 Am to 2:30 PM
Communicating with Detainees
In addition to visits, communication with inmates can occur via mail and telephone. Prepaid calling cards are available via the facility’s shop. Offenders can also receive emails via the facility’s electronic messaging service.
Additional Information
The institution offers educational and rehabilitation programs for detainees, including GED classes and substance abuse treatment. Always check with the Hendry County Jail for updates on regulations and procedures.
Hendry County Sheriffs Office - Substation
- Address
- 712 East El Paso Avenue, Clewiston, Florida, 33440
- Phone
- 863-983-1440
- Website
- website
Florida Inmate Search
Hendry County, FL Incarceration Statistics
| Jails | 168 |
|---|---|
| Inmate Population | 180 |
| Daily Inmate Population | 229 |
| Female Inmate Population | 23 |
| Male Inmate Population | 137 |
| Jail Rate | 700 |
Hendry County, FL Jail Inmate Population, Jail Pretrial Population and Confined Population, for 2010-2015 years
| 2010 | 2011 | 2012 | 2013 | 2014 | 2015 | |
|---|---|---|---|---|---|---|
| Total Inmate Population | 168 | 168 | 168 | 168 | 168 | 168 |
| Pretrial Population | 2,098 | 1,900 | 1,891 | 1,700 | 1,700 | 1,700 |
| Confined Population | 180 | 180 | 180 | 180 | 180 | 180 |
Hendry County, FL Female Population, Rate & Count for 2010-2015 years
| 2010 | 2011 | 2012 | 2013 | 2014 | 2015 | |
|---|---|---|---|---|---|---|
| Population | 11,381 | 11,362 | 11,122 | 11,292 | 11,615 | 11,712 |
| Rate | 182 | 189 | 200 | 204 | 204 | 204 |
| Count | 21 | 22 | 22 | 23 | 23 | 23 |
Hendry County, FL Male Population, Rate & Count for 2010-2015 years
| 2010 | 2011 | 2012 | 2013 | 2014 | 2015 | |
|---|---|---|---|---|---|---|
| Population | 14,162 | 13,981 | 12,917 | 12,724 | 12,916 | 12,921 |
| Rate | 1,034 | 1,025 | 1,085 | 1,077 | 1,077 | 1,077 |
| Count | 146 | 143 | 140 | 137 | 137 | 137 |
Hendry County, FL Incarceration Rates by Race, for 2010-2015 years
| 2010 | 2011 | 2012 | 2013 | 2014 | 2015 | |
|---|---|---|---|---|---|---|
| White | 630 | 701 | 814 | 904 | 904 | 904 |
| Black | 2,098 | 1,900 | 1,891 | 1,700 | 1,700 | 1,700 |
| Latino | 284 | 277 | 277 | 262 | 262 | 262 |
| Asian | 1,521 | 1,623 | 1,768 | 1,923 | 1,923 | 1,923 |
Directions
Refer the map below to find the driving directions.